MARKETING NEWS
Here’s a script to spice up your Facebook demographics reporting
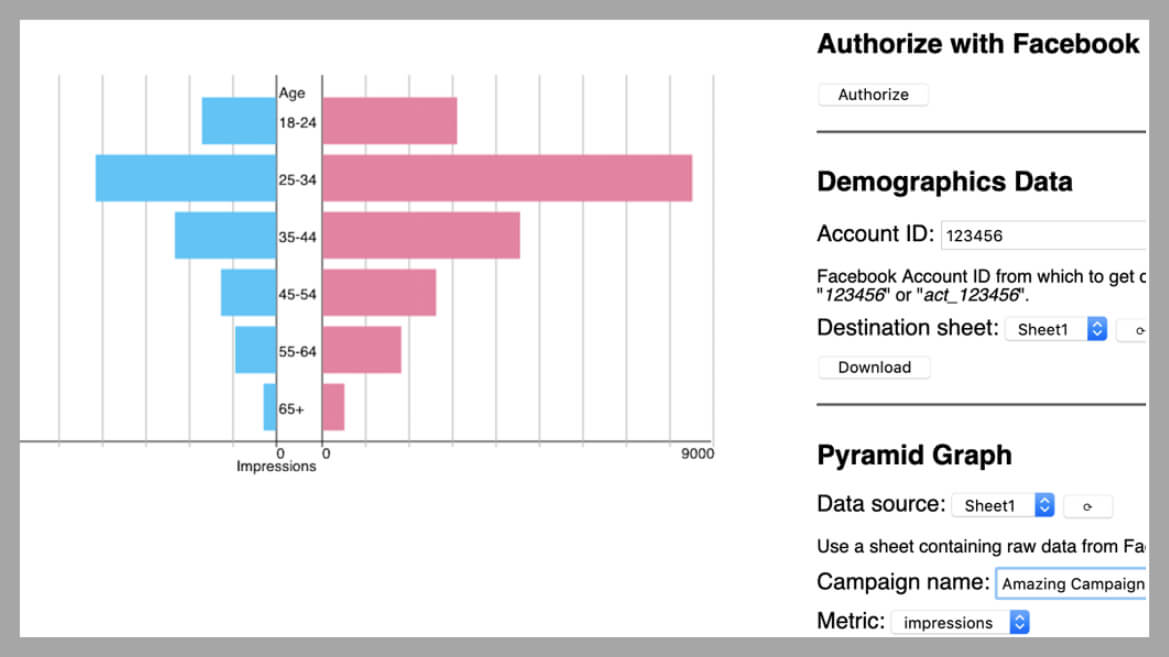
Believe me when I say that I love data. Unfortunately, raw data itself isn’t always the most exciting thing to look at. Gaining valuable insights from it can take a bit of time if you’re not sure how to interpret it.This script is for all keen social marketers looking to jazz up their demographics data reports. If you need to do some performance analysis for Facebook, here’s an age and gender reporting script that automatically formats your data into a ready-made pyramid graph!The tool works as a Google Sheets add-on and is incredibly easy to run. It pulls a demographics report for your Facebook campaigns for clicks, impressions, and spend, broken down by gender and age for the last seven days.And here’s where the magic happens. With the click of a button, the add-on generates a pyramid graph showing campaign performance of a given metric for your audiences, segmented by age and gender. Spotting your best-performing demographic segment has never been easier.How to use itHead to the add-on’s Chrome Web Store page and click on “Add to Chrome.”Upon installation, you’ll need to authorize the add-on to run on your Google account, after which it will appear in the add-ons menu bar when you create a new spreadsheet. You’ll also need to authorize it to connect to Facebook, which you can do by opening the add-on’s sidebar.Then, you need to fill in your Facebook account ID (you can get this by going to “Business Manager” > “Ad Account Settings” on Facebook) and click “Download” to pull the data into the spreadsheet.The spreadsheet will load impression, click, and spend data for your active campaigns for the last seven days, segmented by gender and age.To make a pyramid graph, copy the name of one of your campaign names from column A and paste it in under the Pyramid Graph section of the sidebar. Pick the metric for which you would like to see the graph for (i.e. impressions, clicks, spend, CTR, or CPC) and click “Create.”Your pyramid graph will appear, shiny and ready for use! Just right-click and save the image to your computer if you want to keep it, and repeat for all your other campaigns.Opinions expressed in this article are those of the guest author and not necessarily Marketing Land. Staff authors are listed here. About The Author Daniel Gilbert is founder and CEO of Brainlabs,the smartest performance marketing agency on the planet. As the self-proclaimed superhero of PPC, Daniel’s mission is to change the future of advertising, while creating the best place in the world to work.
Source link